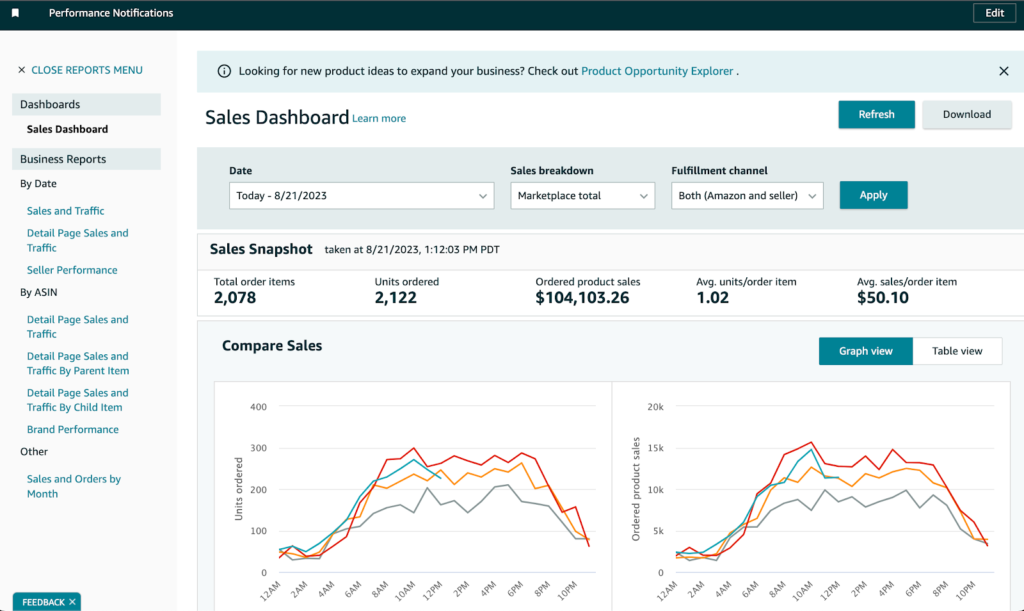
By 10 June this US account had already booked $203K in ordered product sales – a run rate near $38K a month, barely halfway into the year.
This is what compounding looks like when the operating system is set early. 10,221 units moved across 9,293 orders before mid-year, with volume climbing month over month instead of spiking and stalling.
$203,127.12
Ordered product sales
£6K months to £34.8K months in one winter
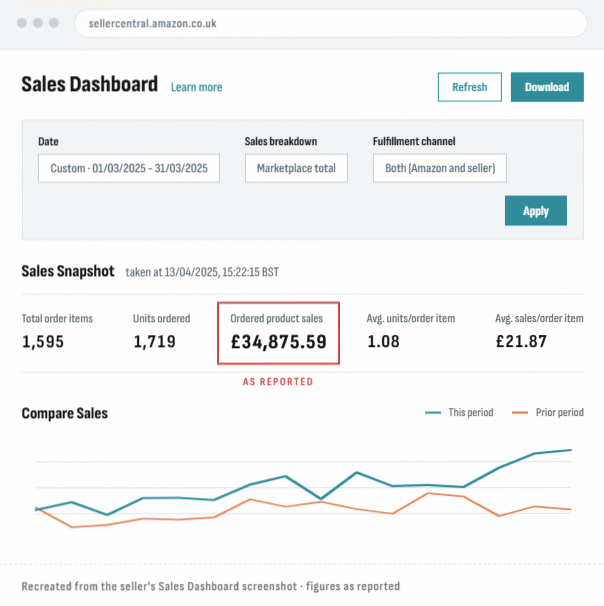
Four months before this snapshot, £6K was a full month on this UK marketplace (entry 04 in the log below). March closed at £34,875 – over 5x the monthly revenue.
Between November and March, catalog control, traffic discipline and order flow were rebuilt as one system instead of separate tasks. Units scaled to 1,719 for the month while average order value held at £21.87 – growth that came from structure, not discounting.
£34,875.59
Ordered product sales
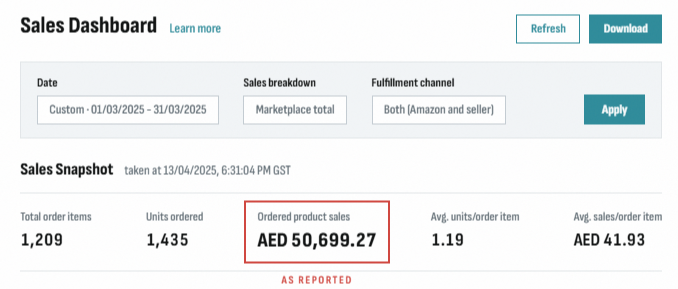
Expansion pace: AED 50.7K in a single month
The UAE expansion didn’t crawl. 1,435 units and AED 50.7K in ordered product sales inside one March – with the strongest order value on this page.
Scaling into a new marketplace usually means buying growth with margin-killing discounts. Here the account moved 1,435 units in the month while holding AED 41.93 average sales per order item – the growth was priced, not bought.
AED 50,699.27
Ordered product sales
The climb, month by month
No.
Marketplace
Window
Ordered Product Sales
Units Ordered
Avg. Sales / Order Item
01
🇬🇧 amazon.co.uk
1–30 Nov 2024
Where the UK Curve Starts
£6,066.86
842
£8.57
02
🇺🇸 amazon.com
1–16 Dec 2024
Only 16 Days of Sales
$18,063.01
611
$31.14
03
🇺🇸 amazon.com
1–31 Mar 2025
Full Month Performance
$20,540.62
864
$26.85
04
🇺🇸 amazon.com
1–16 Apr 2025
Half-Month Window
$8,095.36
400
$22.80
05
🇺🇸 amazon.com
1 Mar–16 Apr 2025
Six Weeks, One Curve
$24,217.05
1,178
$23.20
06
🇬🇧 amazon.co.uk
1–30 May 2025
Holding After the Climb
£16,567.84
878
£20.23
Ready to build what's next?
Want your next four months to look like this?
The UK account went from £6K months to £34.8K months in one winter. If your brand needs that kind of climb – and a partner who can actually run the work – let’s talk.